SNR of Antarctic blue whale calls — Kerguelen 2014 (Castro et al. 2024)
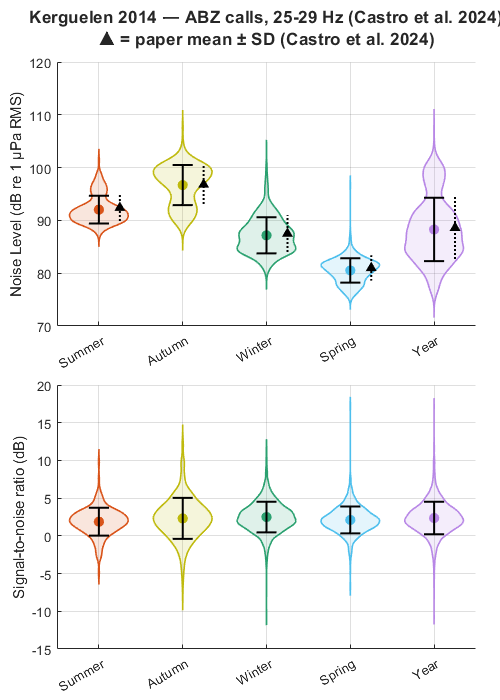
Reproduces the seasonal SNR and noise level distributions shown in Figure 5 of Castro et al. (2024). ABW A, B, and Z calls are pooled across 12 months at Kerguelen Island, with SNR and noise level estimated using calibrated spectrogramSlices (25-29 Hz, simple power ratio). Noise levels match the paper within 0.5 dB after bandwidth correction.
REFERENCE Castro, F.R. et al. (2024). Beyond Counting Calls: Estimating Detection Probability for Antarctic Blue Whales. Frontiers in Marine Science. https://doi.org/10.3389/fmars.2024.1406678
DATA Annotations and recordings: Australian Antarctic Data Centre https://data.aad.gov.au/metadata/AcousticTrends_BlueFinLibrary https://doi.org/10.26179/5e6056035c01b Calibration: loadRecorderMetaData('Kerguelen2014') [longTermRecorders] Contact aadcwebqueries@aad.gov.au for access.
Contents
User configuration
Edit the paths below to match your local installation. Annotations are part of the IWC-SORP Annotated Library public download (doi:10.26179/5e6056035c01b). Recordings are available from the same DOI. Calibration metadata requires loadRecorderMetaData() from the longTermRecorders toolbox (contact aadcwebqueries@aad.gov.au).
annotationRoot = 's:\work\annotatedLibrary\SORP\kerguelen2014\';
soundFolder    = 's:\work\annotatedLibrary\SORP\kerguelen2014\wav\';
siteCode       = 'Kerguelen2014';

% STFT parameters from BmZspectroParams.m
nfft     = 1024;
nOverlap = floor(nfft * 0.85);   % 870 samples

% SNR parameters matching callDensityParams.m
signalFrequencyBand   = [25 29];  % Hz — unit-A band
noiseLocationStrategy = 'beforeAndAfter';
noiseDelaySeconds     = 1.0;

% Call types — pooled as ABZ following Castro et al. (2024)
callTypePattern = '*.Bm.Ant-*selections.txt';
pooledCallLabel = 'ABZ';

% Output verbosity
showBsnrProgress = false;
Suppress expected warnings
warning('off', 'snrEstimate:nfftAutoSelected');
warning('off', 'snrEstimate:nfftTruncation');
warning('off', 'snrEstimate:nfftHighTruncation');
warning('off', 'MATLAB:table:ModifiedAndSavedVarnames');
Published values from Castro et al. (2024) Table/Figure 5
Noise level mean and std by season (dB re 1 µPa, mean PSD in [25-29] Hz band)
paperNL.seasonOrder = {'summer', 'autumn', 'winter', 'spring', 'year'};
paperNL.mean = [92.4, 96.8, 87.5, 81.0, 88.6];
paperNL.std  = [ 2.6,  3.7,  3.5,  2.4,  5.9];
Load calibration metadata
fprintf('Loading calibration metadata for %s...\n', siteCode);
recorderMetadata = loadRecorderMetaData(siteCode);
fprintf('  Sensitivity: %.1f dB re V/µPa\n', recorderMetadata.hydroSensitivity_dB);
fprintf('  ADC peak: %.1f V\n', recorderMetadata.adPeakVolt);
Loading calibration metadata for Kerguelen2014...
  Sensitivity: -165.5 dB re V/µPa
  ADC peak: 1.5 V
Load annotations
fprintf('\nLoading Raven selection tables...\n');
ravenFileList = dir(fullfile(annotationRoot, callTypePattern));
if isempty(ravenFileList)
    error('No Raven selection tables found in %s', annotationRoot);
end

allDetections = table();
for f = 1:numel(ravenFileList)
    ravenFilePath = fullfile(ravenFileList(f).folder, ravenFileList(f).name);
    % Infer classification from filename
    if contains(ravenFileList(f).name, 'Ant-A')
        callType = 'BmAntA';
    elseif contains(ravenFileList(f).name, 'Ant-B')
        callType = 'BmAntB';
    elseif contains(ravenFileList(f).name, 'Ant-Z')
        callType = 'BmAntZ';
    else
        callType = 'BmAnt';
    end
    detections = ravenTableToDetection(ravenFilePath, soundFolder, siteCode, callType);
    if ~isempty(detections) && height(detections) > 0
        fprintf('  %s: n=%d\n', callType, height(detections));
        allDetections = [allDetections; detections]; %#ok<AGROW>
    end
end
fprintf('  Total: n=%d\n', height(allDetections));
Loading Raven selection tables...
  BmAntA: n=2557
  BmAntB: n=1177
  BmAntZ: n=563
  Total: n=4297
Compute SNR
fprintf('\nComputing SNR (spectrogramSlices, calibrated)...\n');
snrParams = struct( ...
    'snrType',       'spectrogramSlices', ...
    'nfft',          nfft, ...
    'nOverlap',      nOverlap, ...
    'noiseLocation', noiseLocationStrategy, ...
    'noiseDelay',    noiseDelaySeconds, ...
    'freq',          signalFrequencyBand, ...
    'useLurton',     false, ...
    'metadata',      recorderMetadata, ...
    'showClips',     false, ...
    'verbose',       showBsnrProgress);

snrResults = snrEstimate(allDetections, snrParams);

allDetections.snr         = snrResults.snr;
allDetections.signalLevel = snrResults.signalRMSdB;
allDetections.noiseLevel  = snrResults.noiseRMSdB;

% Convert band-integrated power to mean PSD level in band.
% bsnr returns bandpower() which integrates PSD over [25-29] Hz (4 Hz bandwidth).
% The paper reports mean PSD level: bandpower / bandwidth in dB.
% 10*log10(bandwidth) = 10*log10(4) = 6.02 dB correction.
bandwidthCorrection_dB    = 10 * log10(diff(signalFrequencyBand));
allDetections.noiseLevel  = allDetections.noiseLevel  - bandwidthCorrection_dB;
allDetections.signalLevel = allDetections.signalLevel - bandwidthCorrection_dB;
Computing SNR (spectrogramSlices, calibrated)...
SNR analysis started:  29-Apr-2026 13:59:05
4297 annotations to process (parallel)
0          25          50          75         100%
|-----------|-----------|-----------|------------|
##################################################
SNR analysis completed: 29-Apr-2026 13:59:09
Assign seasons (Southern Hemisphere)
summer: Dec-Feb, autumn: Mar-May, winter: Jun-Aug, spring: Sep-Nov
detectionDatetime = datetime(allDetections.t0, 'ConvertFrom', 'datenum');
allDetections.season = dt2season(detectionDatetime);
Summary statistics by season
seasonOrder  = {'summer', 'autumn', 'winter', 'spring', 'year'};
seasonLabels = {'Summer', 'Autumn', 'Winter', 'Spring', 'Year'};

fprintf('\n%-8s  %5s  %6s  %6s  %6s  %6s  %6s  %6s\n', ...
    'Season', 'n', 'SNR_mn', 'SNR_med', 'NL_mn', 'NL_med', 'NL_paper', 'NL_diff');
fprintf('%s\n', repmat('-', 1, 66));

for s = 1:numel(seasonOrder)
    if strcmp(seasonOrder{s}, 'year')
        mask = isfinite(allDetections.snr);
    else
        mask = allDetections.season == seasonOrder{s} & isfinite(allDetections.snr);
    end
    snrSeason   = allDetections.snr(mask);
    nlSeason    = allDetections.noiseLevel(mask);
    paperNLmean = paperNL.mean(strcmp(paperNL.seasonOrder, seasonOrder{s}));
    nlDiff      = mean(nlSeason) - paperNLmean;
    fprintf('%-8s  %5d  %6.1f  %6.1f  %6.1f  %6.1f  %6.1f  %+6.2f\n', ...
        seasonOrder{s}, sum(mask), ...
        mean(snrSeason), median(snrSeason), ...
        mean(nlSeason), median(nlSeason), paperNLmean, nlDiff);
end
Season        n  SNR_mn  SNR_med   NL_mn  NL_med  NL_paper  NL_diff
------------------------------------------------------------------
summer      221     1.9     2.0    92.0    91.4    92.4   -0.36
autumn      858     2.3     2.3    96.7    97.6    96.8   -0.11
winter     2543     2.5     2.4    87.2    86.8    87.5   -0.33
spring      675     2.1     2.0    80.5    80.8    81.0   -0.48
year       4297     2.4     2.3    88.3    87.5    88.6   -0.32
Figure: seasonal SNR and NL distributions (replicates Figure 5)
seasonColours = [0.85 0.33 0.10;   % summer  — red
                 0.75 0.73 0.05;   % autumn  — olive
                 0.17 0.63 0.44;   % winter  — teal
                 0.30 0.75 0.93;   % spring  — sky blue
                 0.72 0.53 0.90];  % year    — lavender

fig1 = figure('Name', 'Castro 2024 Figure 5 — SNR and NL by season', ...
    'Units', 'pixels', 'Position', [50 50 500 700]);
tlo1 = tiledlayout(fig1, 2, 1, 'TileSpacing', 'compact', 'Padding', 'compact');
title(tlo1, sprintf('Kerguelen 2014 — ABZ calls, %d-%d Hz (Castro et al. 2024)\n▲ = paper mean ± SD (Castro et al. 2024)', ...
    signalFrequencyBand(1), signalFrequencyBand(2)), 'FontWeight', 'bold');

for panel = 1:2
    nexttile(tlo1);
    hold on;

    for s = 1:numel(seasonOrder)
        if strcmp(seasonOrder{s}, 'year')
            mask = isfinite(allDetections.snr);
        else
            mask = allDetections.season == seasonOrder{s} & isfinite(allDetections.snr);
        end

        if panel == 1
            vals = allDetections.noiseLevel(mask);
        else
            vals = allDetections.snr(mask);
        end
        vals = vals(isfinite(vals));
        if numel(vals) < 5, continue; end

        % Violin using ksdensity
        [ksDensity, ksGrid] = ksdensity(vals, 'NumPoints', 200);
        ksDensity = ksDensity / max(ksDensity) * 0.35;  % normalise width
        xPos = s;
        fill([xPos + ksDensity, xPos - fliplr(ksDensity)], ...
             [ksGrid, fliplr(ksGrid)], ...
             seasonColours(s,:), 'FaceAlpha', 0.15, ...
             'EdgeColor', seasonColours(s,:), 'LineWidth', 1.2, ...
             'HandleVisibility', 'off');

        % Mean and std error bars
        valMean = mean(vals);
        valStd  = std(vals);
        plot(xPos, valMean, 'o', 'MarkerSize', 7, ...
            'MarkerFaceColor', seasonColours(s,:), ...
            'MarkerEdgeColor', seasonColours(s,:), ...
            'HandleVisibility', 'off');
        plot([xPos xPos], valMean + [-1 1]*valStd, 'k-', 'LineWidth', 1.5, ...
            'HandleVisibility', 'off');
        plot(xPos + [-0.12 0.12], [valMean-valStd valMean-valStd], 'k-', 'LineWidth', 1.5, ...
            'HandleVisibility', 'off');
        plot(xPos + [-0.12 0.12], [valMean+valStd valMean+valStd], 'k-', 'LineWidth', 1.5, ...
            'HandleVisibility', 'off');
    end
    % Overlay paper NL mean ± std for NL panel
    if panel == 1
        for s = 1:numel(seasonOrder)
            pMean = paperNL.mean(strcmp(paperNL.seasonOrder, seasonOrder{s}));
            pStd  = paperNL.std(strcmp(paperNL.seasonOrder, seasonOrder{s}));
            plot(s + 0.25, pMean, 'k^', 'MarkerSize', 6, 'MarkerFaceColor', 'k', ...
                'HandleVisibility', 'off');
            plot([s+0.25 s+0.25], pMean + [-1 1]*pStd, 'k:', 'LineWidth', 1.5, ...
                'HandleVisibility', 'off');
        end
    end
    hold off;

    set(gca, 'XTick', 1:numel(seasonOrder), 'XTickLabel', seasonLabels, ...
        'XTickLabelRotation', 30);
    if panel == 1
        ylabel('Noise Level (dB re 1 µPa RMS)');
    else
        ylabel('Signal-to-noise ratio (dB)');
        xline(0, 'k--', 'LineWidth', 0.5, 'HandleVisibility', 'off');
    end
    grid on;
    xlim([0.5 numel(seasonOrder)+0.5]);
end
Save results
outputFile = fullfile(fileparts(mfilename('fullpath')), ...
    'snr_abw_kerguelen2014_castro2024_results.csv');
writetable(allDetections(:, {'t0', 'duration', 'fLow', 'fHigh', ...
    'classification', 'season', 'snr', 'signalLevel', 'noiseLevel'}), ...
    outputFile);
fprintf('\nResults saved to: %s\n', outputFile);
Results saved to: C:\analysis\bsnr\examples\snr_abw_kerguelen2014_castro2024_results.csv